Correct answer is (20)
Distance travelled = Area under speed – time graph
=
= 20 m
16. .(JEE Main 2020 (Online) 4th September Evening Slot )
The speed verses time graph for a particle is shown in the figure. The distance travelled (in m) by
the particle during the time interval t = 0 to t = 5 s will be________.
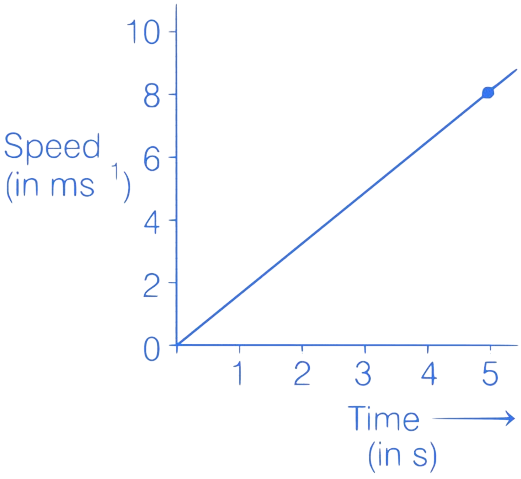
Correct answer is (20)
Distance travelled = Area under speed – time graph
=
= 20 m
17. (JEE Main 2019 (Online) 8th April Evening Slot )
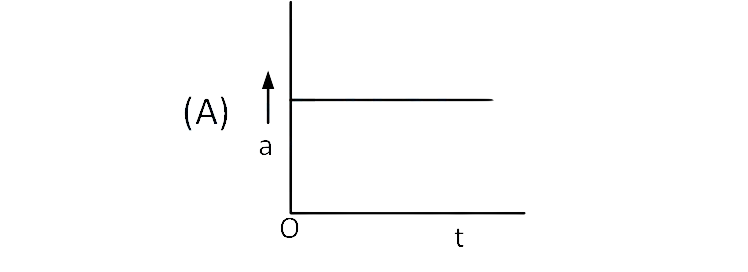
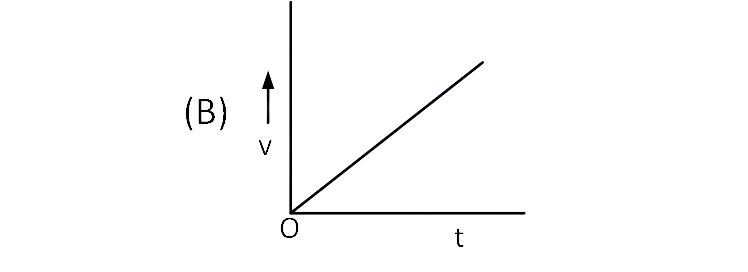
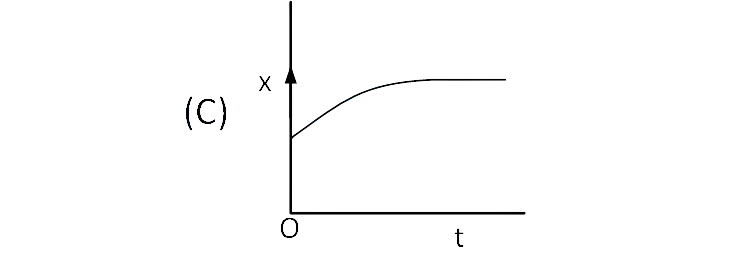
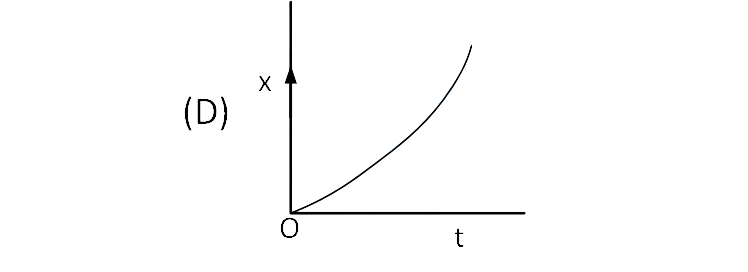
A particle starts from origin O from rest and
moves with a uniform acceleration along the
positive x-axis. Identify all figures that
correctly represent the motion qualitatively.
(a = acceleration, v = velocity,
x = displacement, t = time)
A. (B), (C)
B. (A)
C. (A), (B), (C)
D. (A), (B), (D)
Correct Option is (D)
Given initial velocity u = 0 and acceleration
is constant
At time t
v = 0 + at
v = at
Also
x =
Graph (A), (B) and (D) are correct
18. (JEE Main 2019 (Online) 10th January Evening Slot )
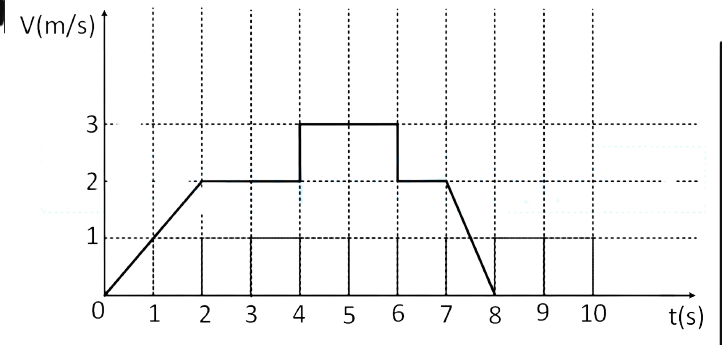
A particle starts from the origin at time t = 0 and moves along the positive x-axis. The graph of velocity
with respect to time is shown in figure. What is the position of the particle at time t = 5s ?
A. 3 m
B. 9 m
C. 10 m
D. 6 m
Correct Option is (B)
S = Area under graph
22 + 2
2 + 3
1 = 9 m
19. (JEE Main 2018 (Offline) )
All the graphs below are intended to represent the same motion. One of them does it incorrectly. Pick it up.
A. 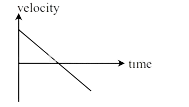
B. 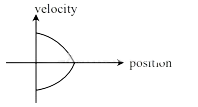
C. 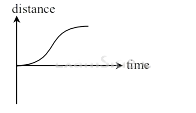
D. 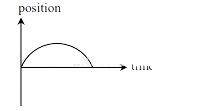
Correct Option is (C)
In option (A) you can see velocity versus time graph is a straight line with negative slope, so
the acceleration is negative and constant. This motion is look like this.
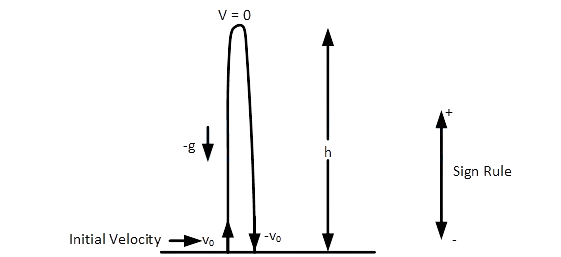
Initially velocity is maximum and as acceleration is negative so after travelling some
distance velocity will will become zero and then velocity will increase in the negative
direction. At option (B) you can see same situation happens so (A) and (B) represent same
situation.
From diagram, Initially at t = 0 position h = 0 and after some time h become maximum at
the end h again become zero. Option (D) represent this situation.
So, A, B and D are correct.
The distance - time graph for this case will be -
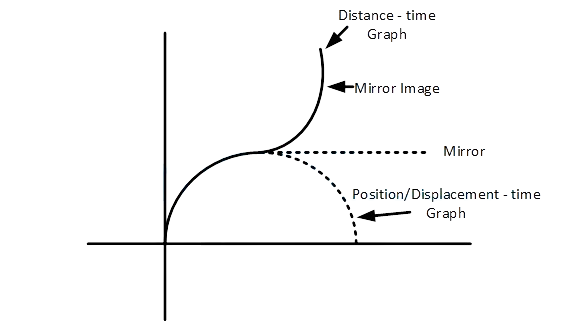
But the given distance-time graph in the question does not match with this so option (C)
will be wrong answer.
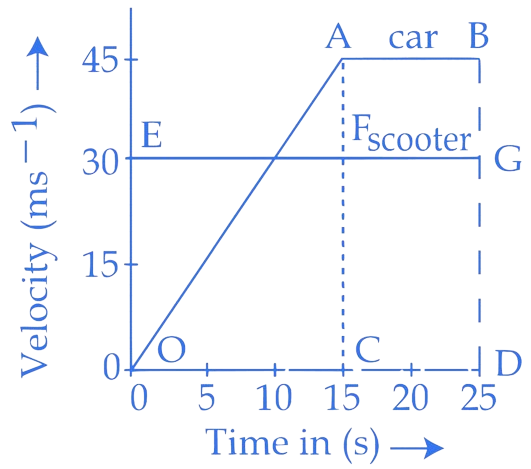
20. (JEE Main 2018 (Online) 15th April Morning Slot )
The velocity-time graphs of a car and a scooter are shown in the figure. (i) The difference between the
distance travelled by the car and the scooter in
and (ii) the time at which the car will catch up with the scooter are, respectively.
A. and
B. and
C. and
D. and
Correct Option is (A)
Till 15 sec car has accelerative motion and scooter has constant velocity in entire motion.
Total Distance travelled by the car in 15 sec, =
(15)2 =
m
Distance travelled by scooter in 15 sec.
= V
t = 30
15 = 450 m
Difference between distance travelled by the car and
scooter in 15 sec,
= 450
= 112.5 m
Now, assume car catches the scooter in time t,
Car travelled in t sec = scooter travelled in t sec.
+
45(t 15) = 30
t
337.5 + 45t
675 = 30t
15 t = 337.5
t = 22.5 sec.