21. (JEE Main 2017 (Online) 8th April
Morning Slot
)
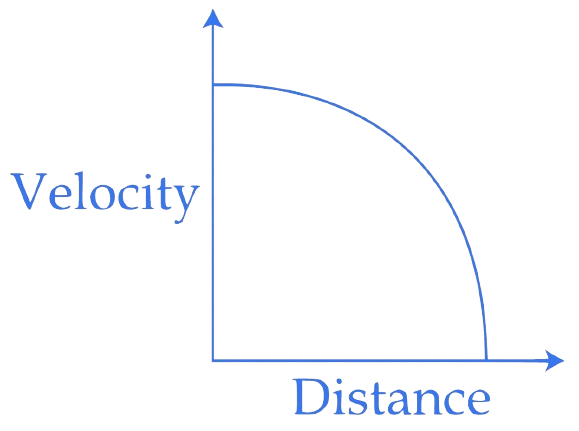
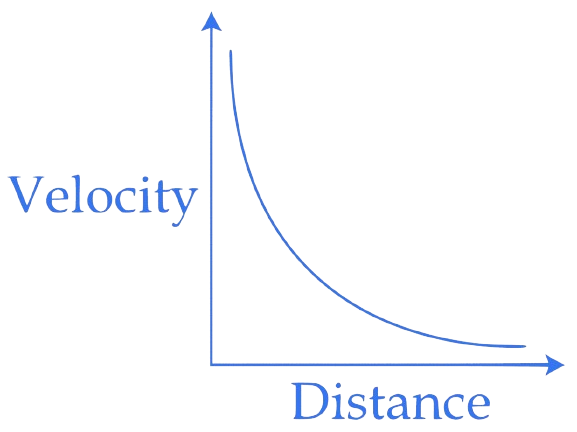
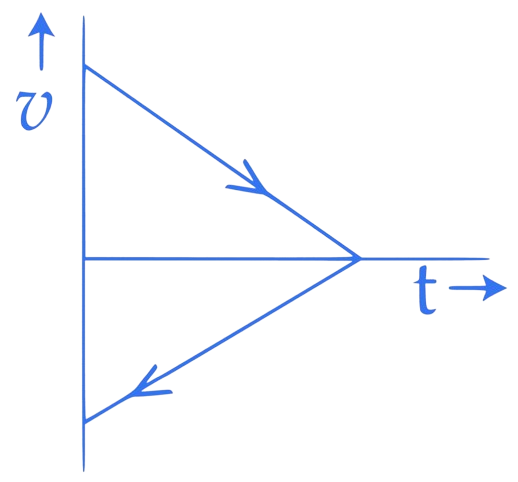
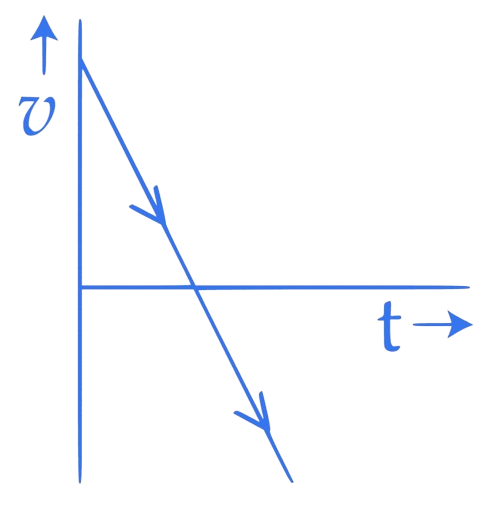
Which graph corresponds to an object moving with a constant negative acceleration and a positive velocity ?
A.
B.
C.
D.
Correct Option is (C)
Given that,
acceleration (a) =
C (constant)
=
c
.
=
c
=
c
=
c
=
cx + k
x =
+
From this equation we can say option (c) is the correct graph.
22. (JEE Main 2017 (Offline)
)
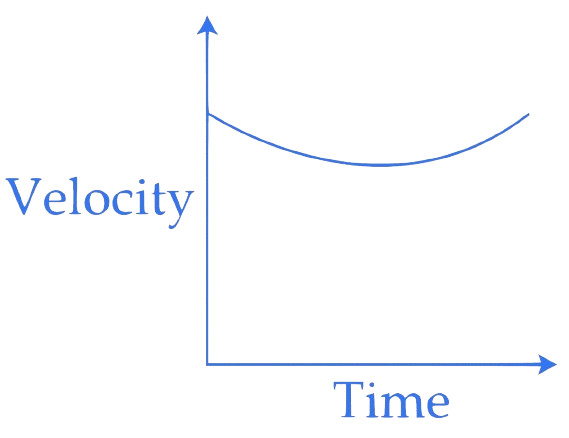
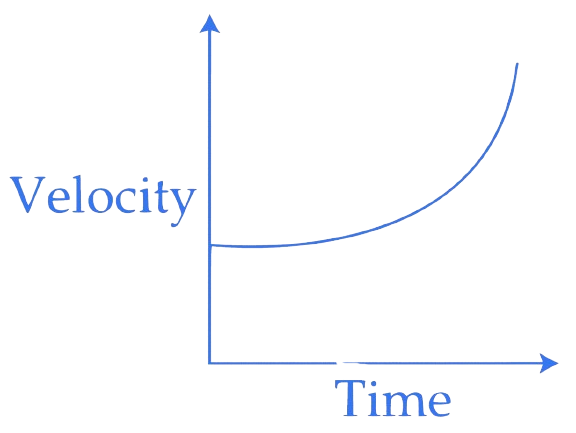
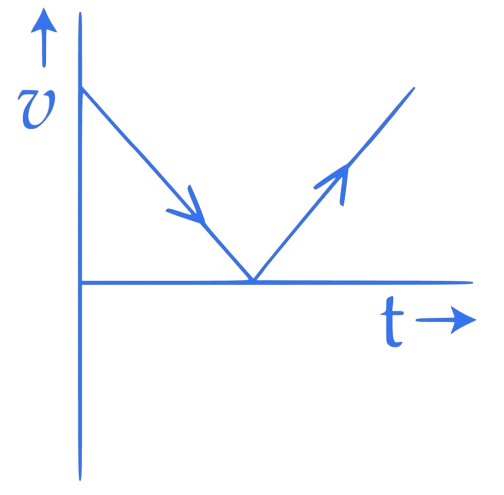
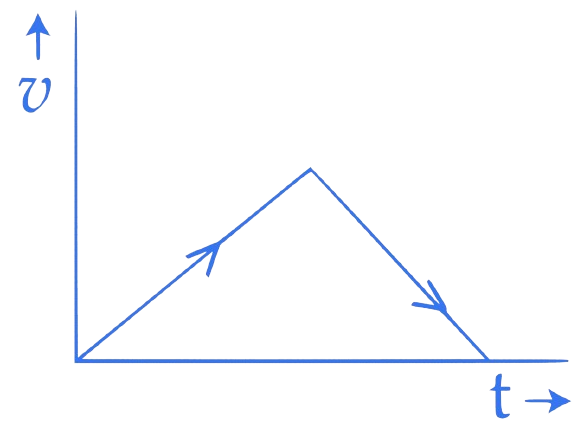
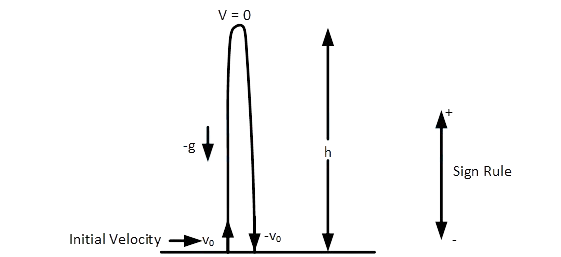
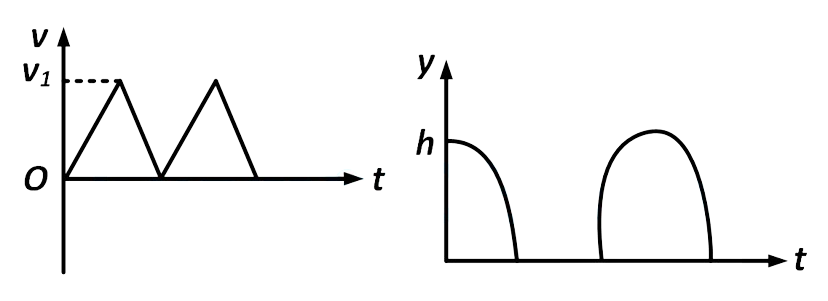
A body is thrown vertically upwards. Which one of the following graphs correctly represent the velocity vs
time?
A.
B.
C.
D.
Correct Option is (D)
Motion of the particle is shown below
Initially speed of the particle is maximum(v0) and at heigth h velocity will
become zero, then particle will move downward and velocity will increase gradually and become
maximum when it reaches the ground. And acceleration in this entire motion will be -g, so slope
of v - t will be same and negative.
So only Option (D) will be correct.
23. (JEE Main 2015 (Offline)
)
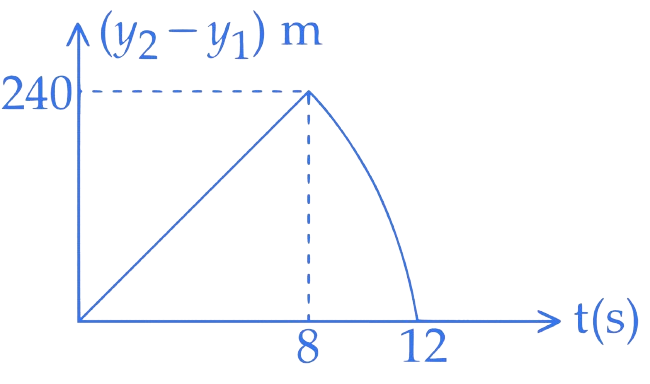
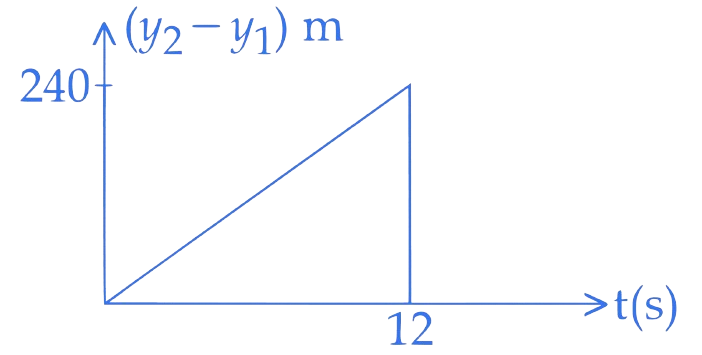
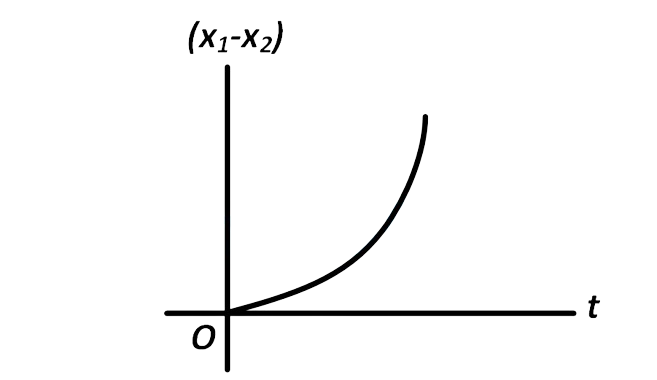
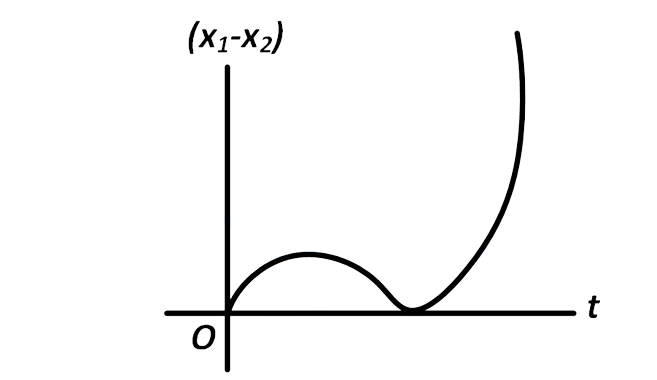
Two stones are thrown up simultaneously from the edge of a cliff
high with initial speed of
and
respectively. Which of the following graph best represents the
time variation of relative position of the second stone with respect to the first ?
(Assume stones do not rebound after hitting the ground and neglect air resistance, take
)
(The figures are schematic and not drawn to scale)
A.
B.
C.
D.
Correct Option is (A)
Using
for
Curve will be straight line when
when stone 1 reaches the ground then
for
So, it will be a parabolic curve till stone 2 reaches the ground. And parabola should
opens upward as coefficient of t2 is positive.
24. (AIEEE 2009
)
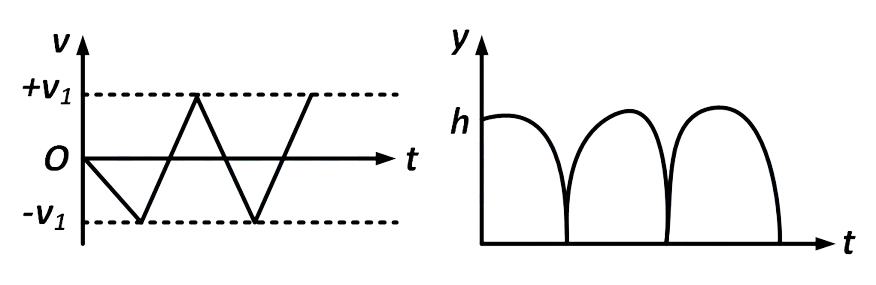
Consider a rubber ball freely falling from a height
onto a horizontal elastic plate. Assume that the duration of
collision is negligible and the collision with the plate is totally elastic.
Then the velocity as a function of time and the height as a function of time will be :
A.
B.
C.
D.
Correct Option is (B)
For downward motion :
The velocity of the rubber ball increases in downward direction and we get a straight
line between
and
with a negative slope.
Also applying
We get
The graph between
and
is a parabola with
at
As time increases
decreases.
For upward motion : The ball suffer elastic collision with the horizontal elastic plate therefore the direction
of velocity is reversed and the magnitude remains the same. Here
where
is the velocity just after collision. As
increases,
decreases. We get a straight line between
and
with negative slope.
Also
All these characteristics are represented by graph
25. (AIEEE 2008)
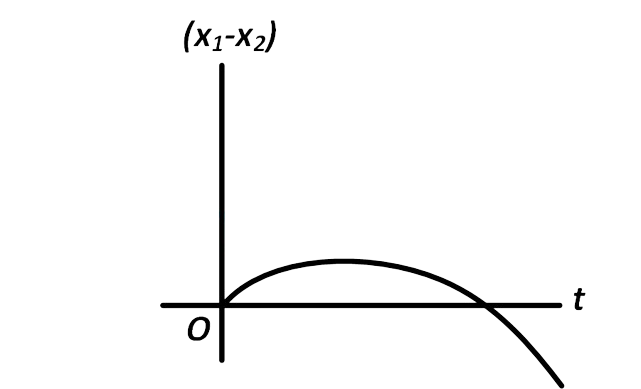
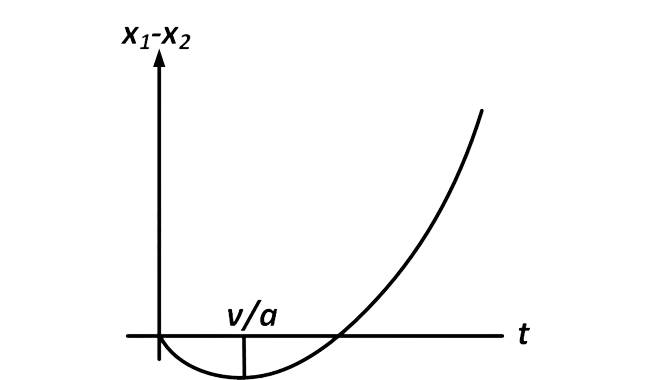
A body is at rest at
At
it starts moving in the positive
-direction with a constant acceleration. At the same instant
another body passes through
moving in the positive
direction with a constant speed. The position of the first body
is given by
after time
and that of the second body by
after the same time interval. Which of the following graphs
correctly describes
as a function of time
?
A.
B.
C.
D.
Correct Option is (B)
For the body starting from rest
For the body moving with constant speed
at
, so graph should start from origin.
For
the slope is negative that means
< 0 so initially velocity of 1st body is less
than second body and velocity of 1st body is increasing gradually.
For
the slope is zero. So
= 0 it means here velocity of both the bodies are
same.
For
the slope is positive. So
> 0 it means here velocity of first body is
greater than second body.
We know the relation between distance and time is.
, which is a equation parabola. So the graph should
be a parabola.